This is an archive of the old PisteHors.com forum

News | Gear | Ski Areas | Hiking | Mountain Biking
Powered by Google™
   
 
Flowcapt Snow Monitoring Stations
Posted: 10 November 2009 02:41 PM  
Administrator
RankRankRankRank
Total Posts:  2234
Joined  2003-10-24

Flowcapt is a group of automatic snow monitoring stations.

http://www.nivometeo.com/

They cover France and Switzerland. There are five stations in the Savoie and three in the Isere and four in Switzerland. They have been financed by the Conseil Général in the respective departments. They seem to offer some interesting data, although they are somewhat hard to read.

The following data seems useful for preparing a ski tour.

i. wind transport of snow: a microphone in a tube registered impacts of snow particules on the tube.
ii. wind direction and speed. The meteo France weather stations don’t give wind direction. Curves give the wind speed and points the direction. Watch out for zero measures, the anemometre may be simply frozen or broken.

http://213.3.18.26/flowcapt/stations/FHUE1/

Looking at the the graph for l’Alpe d’Huez (link above). The left side is the last six months, the right the last 7 days. On the 4th and 7th November the wind was quite strong, certainly at a speed to transport snow. The 7th saw an episode of foehn (chinook for our north american friends) but otherwise it has been a cold, northerly wind. Again we can see the snow transport corresponding to these days on the top graph (green/yellow for different particule size).

There was snow on the 5th, about 20cm with some fresh on the evening of the 7th. Air temperature is around 5C… more of this in another thread.

Some of the sites have two sensors for measuring snow depths. At Tignes we can see that there is 75cm / 30cm on the ground (maybe due to wind transport eroding the zone under one sensor).

http://213.3.18.26/flowcapt/stations/FCHE1/


Posted: 11 November 2009 06:07 AM   [ # 1 ]  
Sr. Member
RankRankRankRank
Total Posts:  270
Joined  2008-01-31

Thanks for pointing it this new source of data—new for me anyway.

I’m seeing the same differences you gave as differences between these Flowcapt sensors and the “Nivose” sensors: “flux” of drifting snow, and direction of wind.

I’m not understanding the fifth data series in the graphical display: “Norm Cumul Flow Index”.

And I’m not getting the significance of “Int/Ext” for qualifying the air remperature data series. 

The disparity between the snow depths shown by the two sensors at Chevril / Tignes is interesting—and wind transport does seem like an obvious explanation.

So now how about an attempt at explaining the “snow depth” shown for Celliers in the Lauziere group:
http://213.3.18.26/flowcapt/stations/FCEL1/
showing 10-15cm of snow all summer long (which seems unlikely to be true at the altitude of that sensor).

Also for that station, it seems odd to me that the 24-hour temperature fluctuations are less than 5 degrees C. Seems like much smaller night versus daytime fluctuations than I expect at low elevations. Has it just been very cloudy for the past week? Or am I not understanding how air temperature works at higher elevations?

Ken


Posted: 12 November 2009 04:14 PM   [ # 2 ]  
Administrator
RankRankRankRank
Total Posts:  2234
Joined  2003-10-24

I assume the 10-15cm is due to poor calibration, or maybe a stone rolling under the sensor. These things work by having an ultrasonic sensor mounted high off the ground (3-4 meters is enough for the Alps, we don’t get monster US snowpacks). The sensor works like those digital tape measures that realtors use.

> I’m not understanding the fifth data series in the graphical display: “Norm Cumul Flow Index”.

I think this may be the quantity and direction of blown snow but I’m just guessing based on some correspondance with the graphs above.

I don’t understand why there is not more diurnal temperature variation on these sensors. The meteo france stations are teh same. Maybe it is due to the cloud cover we’ve had over the last week?


Posted: 14 December 2009 08:13 PM   [ # 3 ]  
Newbie
Rank
Total Posts:  11
Joined  2009-12-09

Thanks for the link, which is also new to me, and is very interesting. It’s a shame there isn’t more detail on just what these sensors are measuring. This post is an attempt to understand this a bit better.

The instruments are better described on the Campbell Scientific website http://www.campbellsci.co.uk/ and the flowcapt site http://www.flowcapt.com/. The “technical notice” on the latter describes the snowdrift sensor. 

I ski in the Espace Killy, so I’ll focus on the Tignes sensor http://213.3.18.26/flowcapt/stations/FCHE1/ . This is actually on the east side of the main road (the opposite side to Tignes), so well away from all but the most determined skiers.

Like you, I was puzzled by the light blue “snow height” curve, but I think you are right that there are two sensors and the light blue curve is the exposed sensor. (The dark blue curve is close to the official depth for the altitude.)

To start with I was confused by the configuration shown at http://213.3.18.26/flowcapt/stations/FCHE1/FCHE1_image.html (reached by clicking on “Informations” near the top of the page. This page also gives a map of where the sensor is and a location on Google Earth.) The schematic configuration doesn’t show it as having a snow depth sensor at all. However, the historical data 2005-7 on this page don’t include snow depth data either – the graphs are blank. There is a photograph of “Installation Hneige2 Fev09”. “Hneige2” suggests there should be an “Hneige1” somewhere, and it’s reasonable to guess that it’s on the main sensor. The absence of historical data from it suggests that both these sensors were installed relatively recently (Perhaps February 2009? I can’t imagine someone going up there in February to take a picture!) and that they didn’t update the diagram.

It seems likely that one of the snow depth sensors is on the main sensor near the ridge, where it can measure a wind speed and direction accurately. The photograph shows the other as being below the ridge a bit, I think perhaps near the middle of the plateau to the east of the main sensor. The one near the ridge would be more exposed, and one would expect less snow to accumulate there.

By the way, the beam width of the snow height sensor is about 30 degrees, so if the sensor is mounted 2m above ground it is sampling an area of ground ~ 1m in diameter. So don’t worry about stones rolling under the sensor, as you suggest: if the stone was that big, it would have knocked it over!

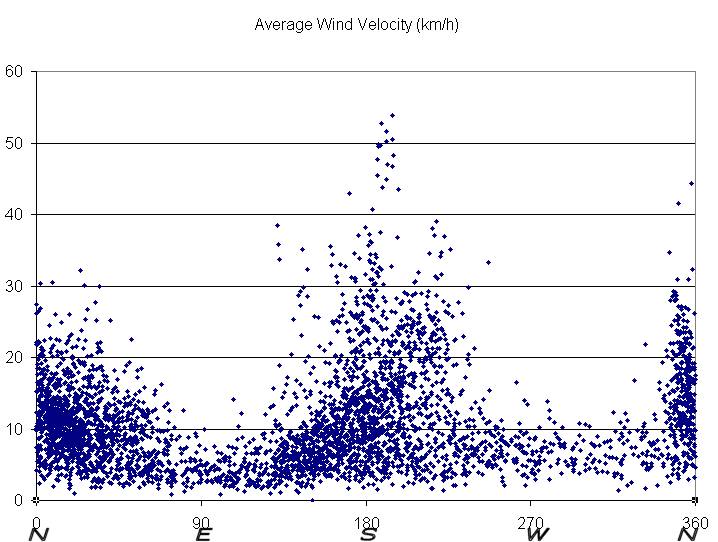
Another thing about the data that struck me was the wind direction. Despite having been skiing in this area for longer than I care to remember, I had not realised how well-defined the prevailing winds are. You can see this by eye on the graphical data, but its more convincing using the excel data they supply (I had to right click on “FCCHE1.xls” and then save it to my hard disk: excel couldn’t open it automatically from the web site for some reason.)

(I wanted to put in a graph here, but couldn’t figure out how to insert a picture.)

Since July this year, the wind at FCCHE1 has only very rarely exceeded 10km/hr from either the east or the west. This is at an altitude of 2869m on a ridge that runs roughly north-south! Strong winds always came from either the north or south, with the south being more common.

Evidently the sensor has been placed with care, and with a knowledge of the prevailing winds. It’s obvious now that I think about it that you have to separate a snow depth sensor (which needs to be sheltered, but not so much that there could be accumulation) and a wind sensor (which needs to be very exposed).

Richard


Posted: 14 December 2009 10:29 PM   [ # 4 ]  
Administrator
RankRankRankRank
Total Posts:  2234
Joined  2003-10-24

Hi Richard,

That is a very extensive and informative post. I uploaded the Excel data to my Picasa account.

wind.jpg

I wanted to plot a “rose” but couldn’t work out how to get Excel to do this but I hope this is clear enough. We see either strong southerly or northerly -> north/easterly winds (I guess the southerly winds are the dreaded foehn). I guess the Rocher de la Davie protects the site from easterly winds, the col/plateau seems to be N.E./S facing on the map.

FCHE1%20-00-%20Emplacement.jpg

The Flowcapt sites are for highways forecasting and protection which may explain the locations.

You may have noticed that the equivalent Meteo France sensors have stopped reading since the 2nd December 2009:

http://www.meteo.fr/temps/france/nivose/pics/BELLES.html

They have an IT problem, apparently, although if I took 12 days to fix something my boss would be icandescent (in fact if it takes more than an hour where I work steam starts pumping out of his ears).